Bitcoin’s 200-day moving average surpasses $50,000 for the first time ever

Quick Take
Bitcoin has been trading between $60,000 and $70,000 since late February, reaching its all-time high above $70,000. However, it briefly dropped below $60,000 at the start of May.
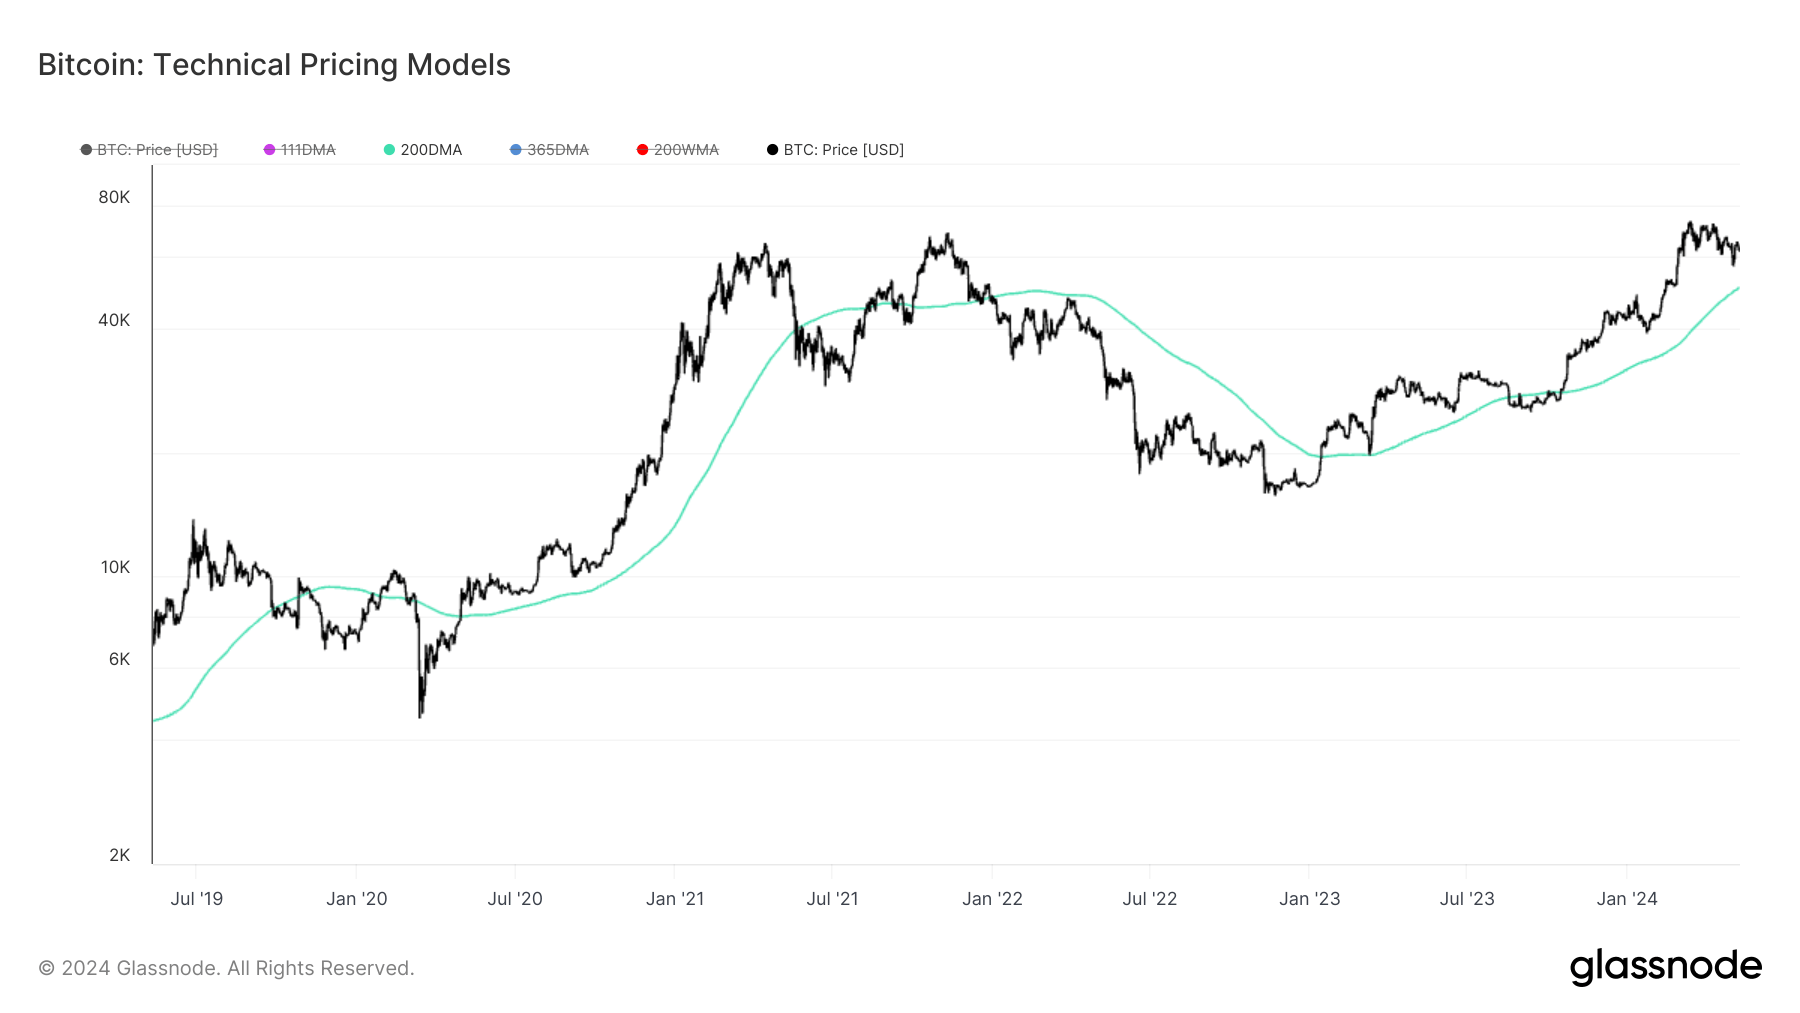
The 200-day moving average (DMA) broke the $50,000 barrier on May 6, with Bitcoin currently around $61,000. This is a significant milestone as the 200DMA is a key indicator of bull and bear market cycles.
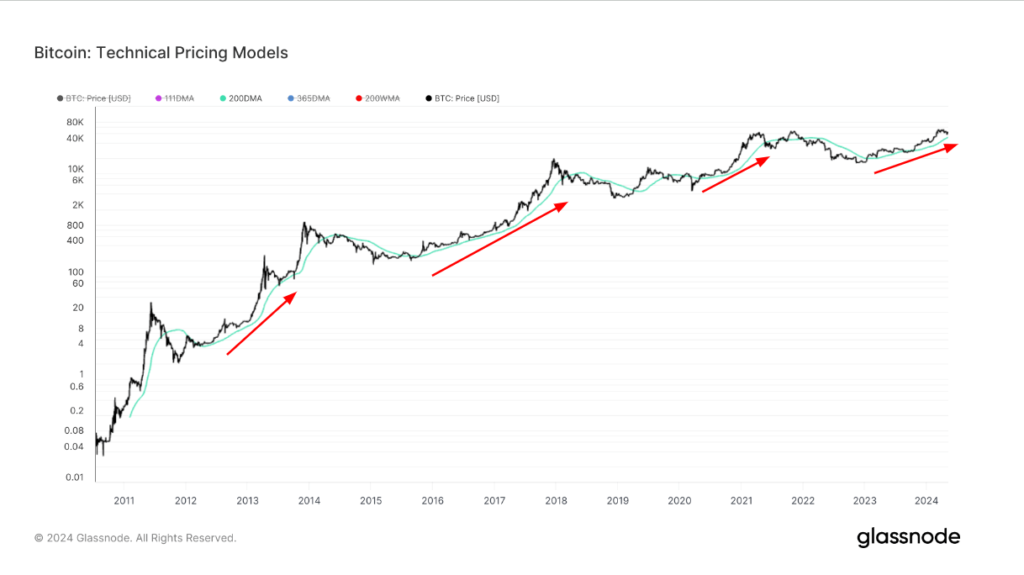
Technical Pricing Models, 200DMA: (Source: Glassnode)
In May 2021, Bitcoin fell below the 200DMA level, signaling the start of the bear market. However, it regained this level in January 2023, kickstarting the current bull run. While there was a brief dip below the 200DMA in October 2023, it has since acted as a strong support.
In previous cycles, staying above the 200DMA was bullish, while dropping below it indicated bearish trends. Maintaining prices above $50,443 could strengthen the current upward trend.

 Technical Pricing Models, 200DMA: July ’19 – May ’24: (Source: Glassnode)
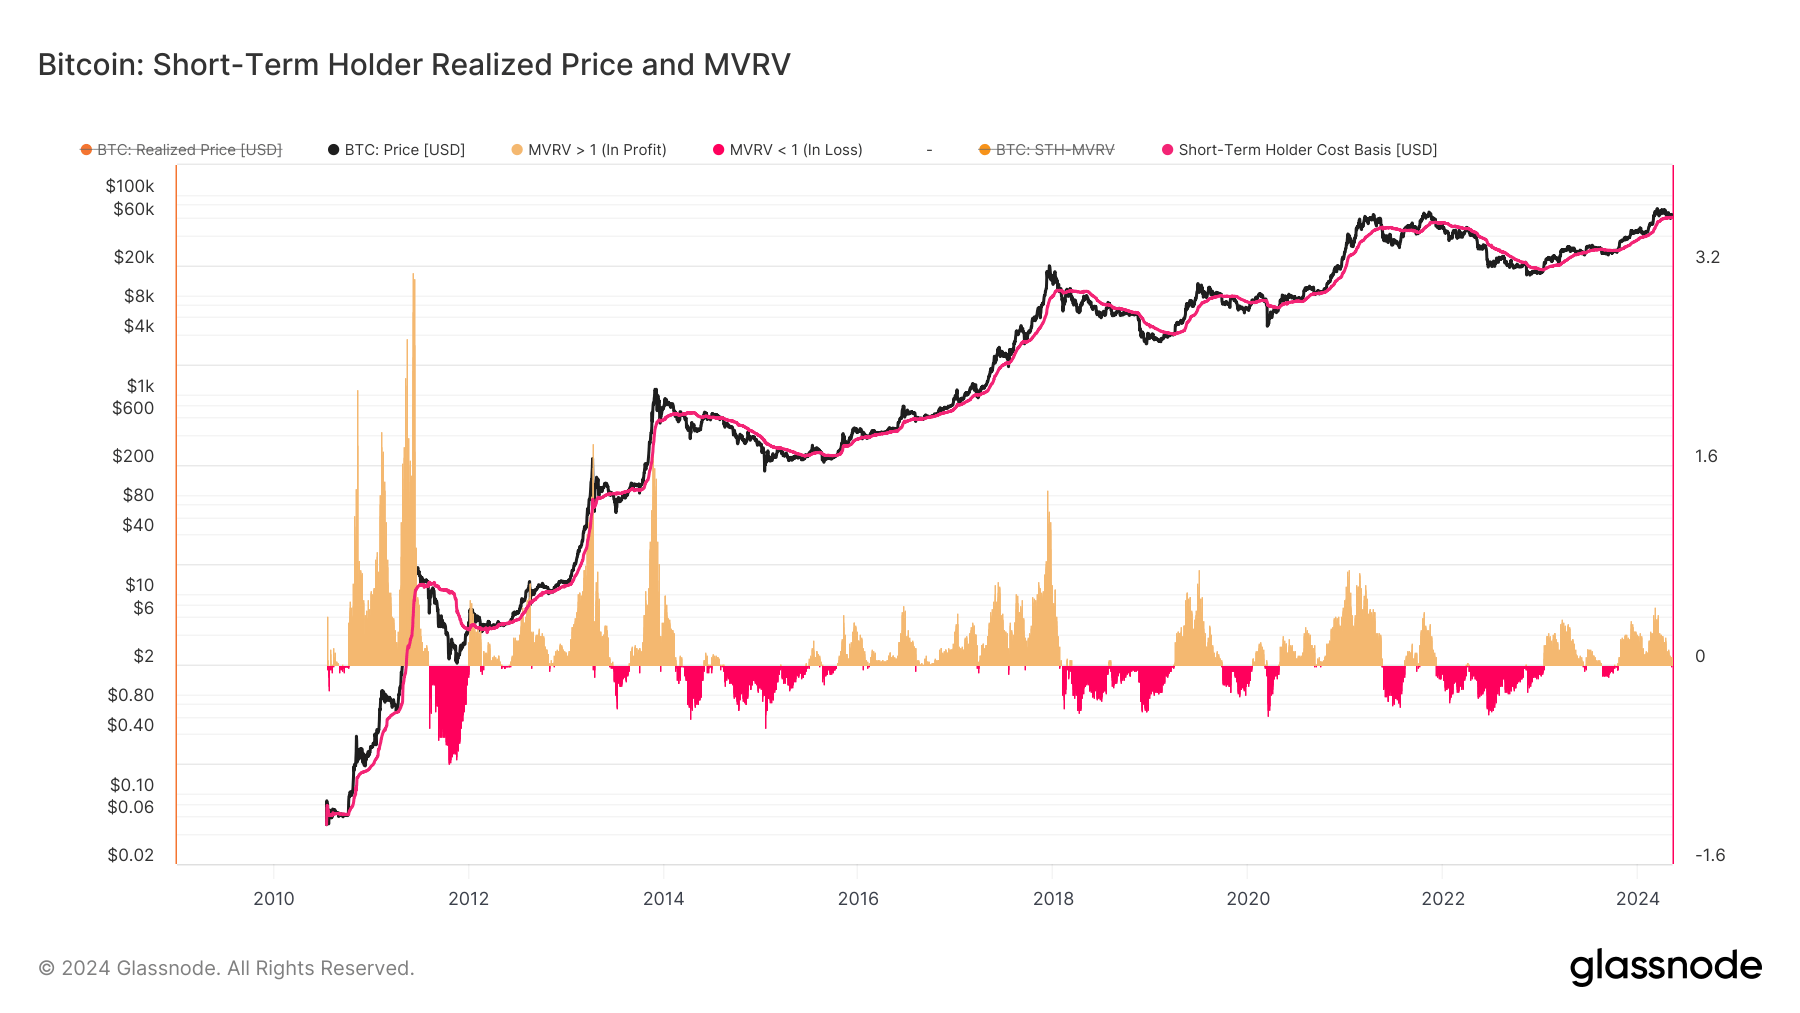
Currently, the short-term holder’s realized price is close to surpassing $60,000.

 Short-Term Holder Realized Price and MVRV: (Source: Glassnode)
Source link
#Bitcoins #200day #moving #average #breaks #time


