The Negative Consequences of Bitcoin Dropping Below $50.5K

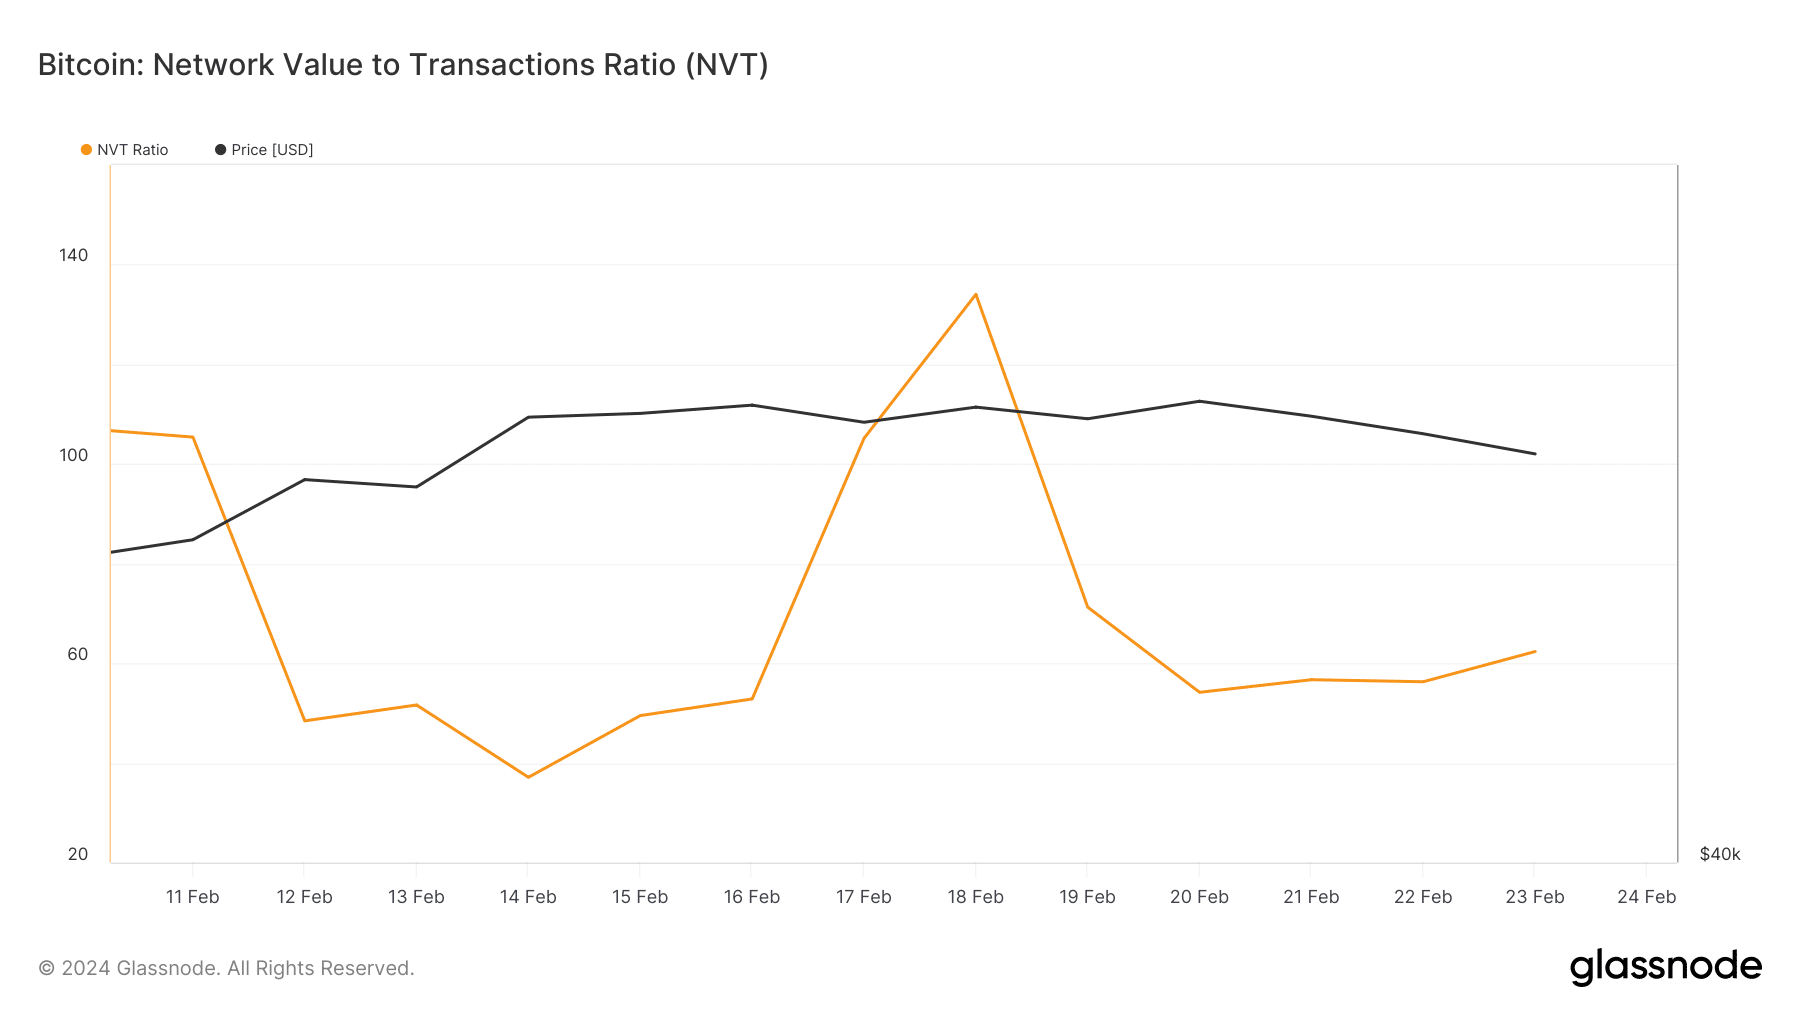
BTC’s NVT ratio declined which meant that it was undervalued.
A few metrics and market indicators looked bearish on Bitcoin.
After crossing the $50,000 mark, Bitcoin’s [BTC] momentum declined again as its value moved sideways. In fact, the king of cryptos price was hovering in between a price band, suggesting a few more slow-moving days ahead.
Bitcoin is slowing down
After growing by nearly 30% in the last 30 days, the price action of BTC turned sluggish once again. This was evident from the fact that its value only moved marginally over the last few days.
At the time of writing, BTC was trading at $50,948.23 with a market capitalization of over $1 trillion.
Coinglass’ recent tweet also pointed out that BTC’s price was moving between the $52k and $50.5k range. These levels also acted as BTC’s resistance and support levels, respectively.
If BTC’s price manages to break out of the resistance zone, the possibility of BTC touching $55,000 is high.
However, if the opposite happens and BTC falls below its support zone, investors might witness a further downtrend. Therefore, to get better clarity, AMBCrypto checked BTC’s on-chain data.
We found that BTC’s Network Value to Transactions (NVT) ratio registered a downtick over the last few days. Whenever the metric declines, it suggests that an asset is undervalued, indicating that there are chances of a price uptick.
Source: Glassnode
A few other metrics also looked bullish. For example, as per our analysis of CryptoQuant’s data, Bitcoin’s exchange reserve was dropping. This meant that buying pressure on the coin was high.
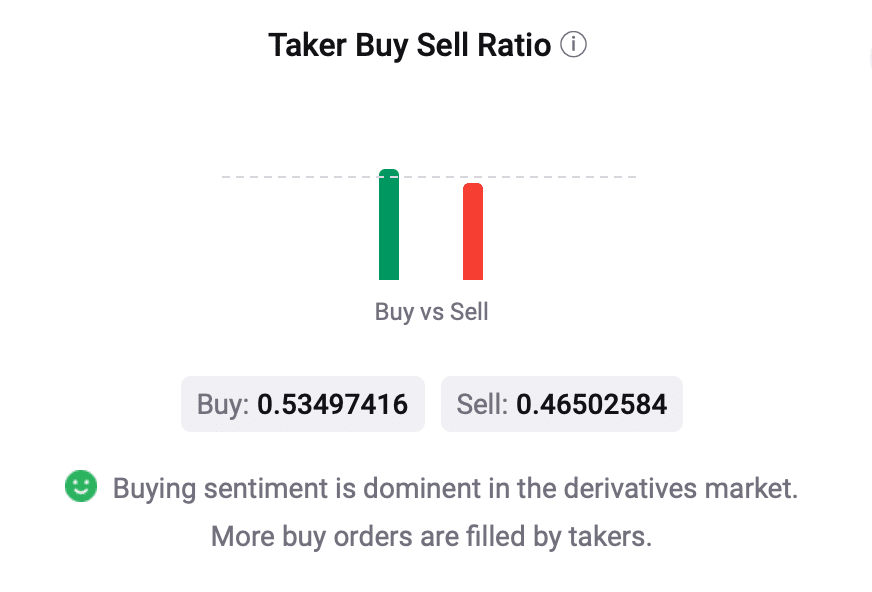
Additionally, buying sentiment was also dominant in the derivatives market, which was evident from its green taker buy/sell ratio.
Source: CryptoQuant
Troubles still remain for Bitcoin
Though the aforementioned metrics looked bullish, a few others suggested otherwise and hinted that BTC’s price might as well reach its support level in the coming days.
AMBCrypto reported earlier that BTC may witness a short-term price correction as there was a movement of coins from long-term holders (LTHs) to short-term holders (STHs).
The token’s Binary CDD continued to remain red, meaning that long-term holders’ movements in the last seven days were higher than average.
Its aSORP was also red. This suggested that more investors were selling at a profit. In the middle of a bull market, it can indicate a market top.
Source: CryptoQuant
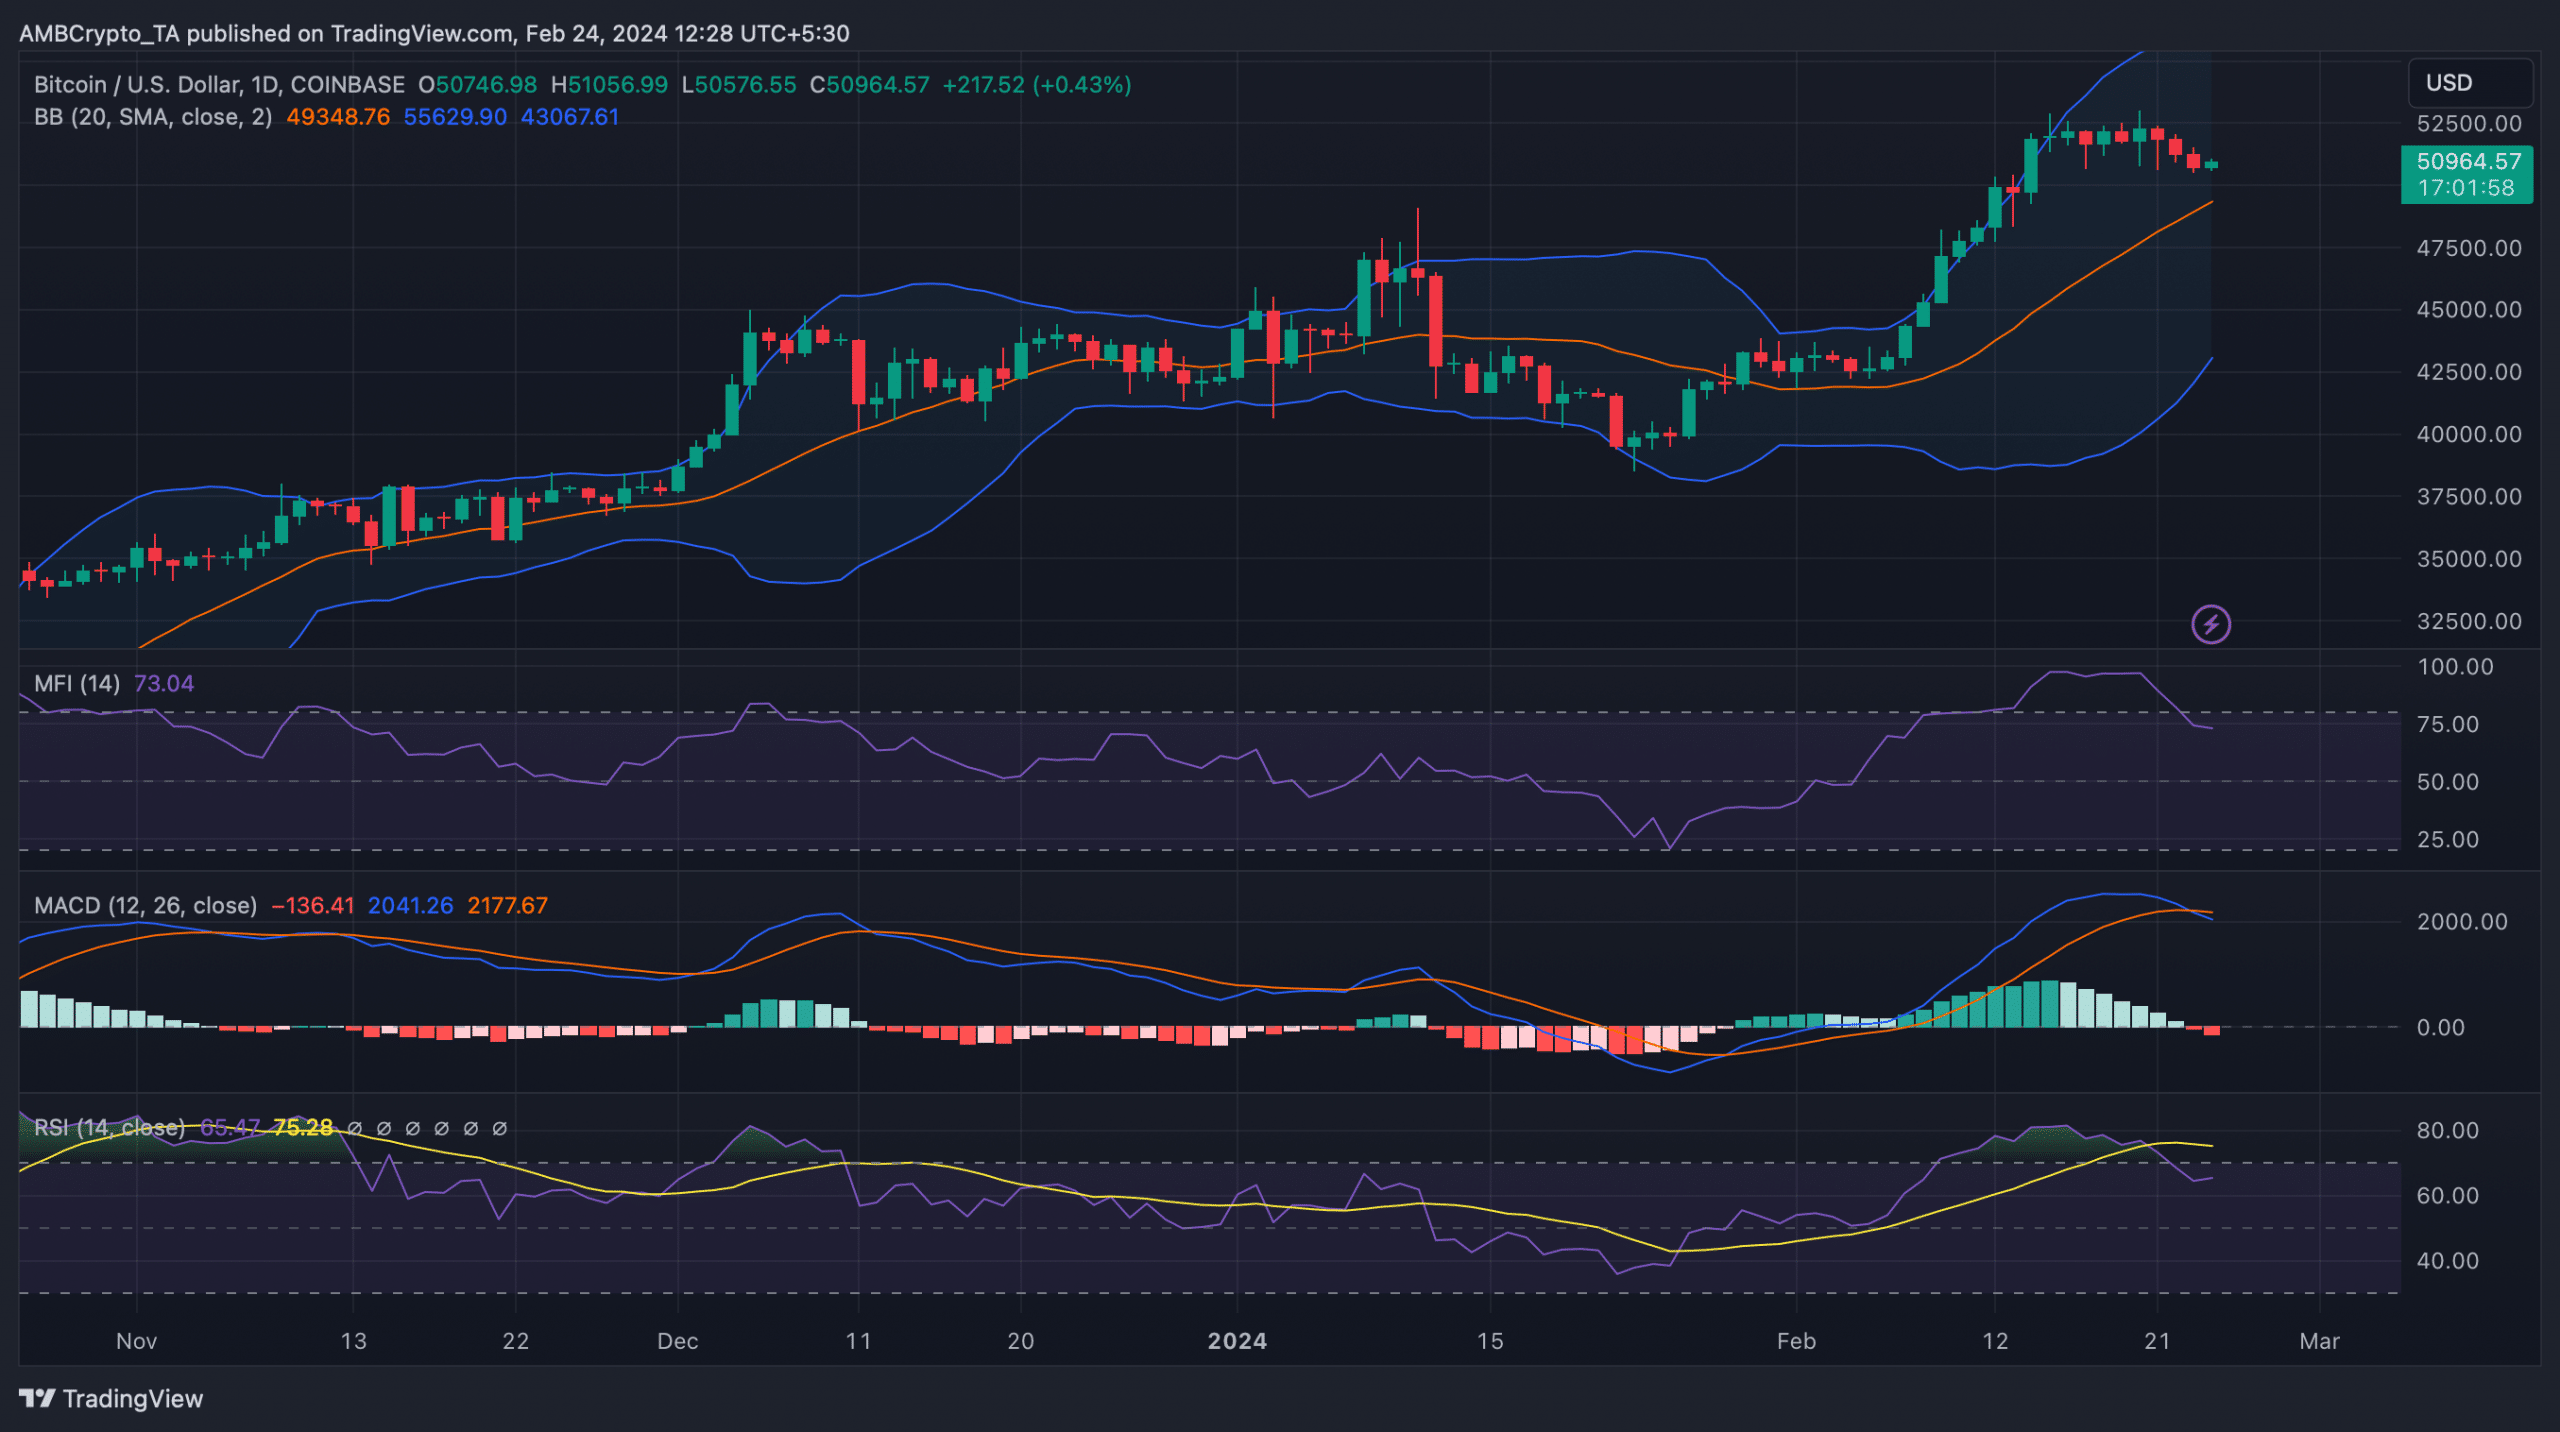
A look at BTC’s daily chart pointed out other bearish indicators. The MACD displayed a bearish crossover.
Read Bitcoin’s [BTC] Price Prediction 2024-25
Both the coin’s Relative Strength Index (RSI) and Money Flow Index (MFI) registered downticks. These metrics suggested that the chances of a drop in BTC’s price were high.
Nonetheless, BTC’s price remained above its 20-day simple moving average, as displayed by the Bollinger Bands. This can act as support and help BTC rebound.
Source: TradingView
Source link
#Bitcoin #drop #50.5K #bad #news


