Will Bitcoin buyers be able to push BTC above $64K?

After a brief hike above $64k, BTC once again dropped below that level.
Some market indicators indicated that BTC was overbought.
After surpassing $64k on the 23rd of September, Bitcoin [BTC] has once again fallen below that threshold. In the meantime, an analyst revealed that the buying pressure on the coin has increased. Will this development significantly impact BTC’s price action?
People are once again purchasing Bitcoin
After much anticipation, BTC finally managed to break through the $64k resistance for a short period. Despite falling below that level again, recent analysis suggested that the buying pressure remained high.
Ali, a popular crypto analyst, recently shared a tweet indicating that investors were accumulating. This assessment was based on the wicks on BTC’s monthly price chart.
Source: X
In fact, AMBCrypto’s analysis of CryptoQuant’s data also highlighted a similar trend. According to our analysis, Bitcoin’s net deposit on exchanges was lower compared to the average of the last seven days. This clearly indicated a rise in buying pressure on the king coin.
Miners were also inclined to hold onto their coins as BTC’s Miners’ Position Index (MPI) was in the green. Additionally, the Coinbase premium suggested a strong buying sentiment among US investors. Typically, an increase in buying pressure leads to a price surge.

Source: CryptoQuant
Will BTC’s price experience another surge?
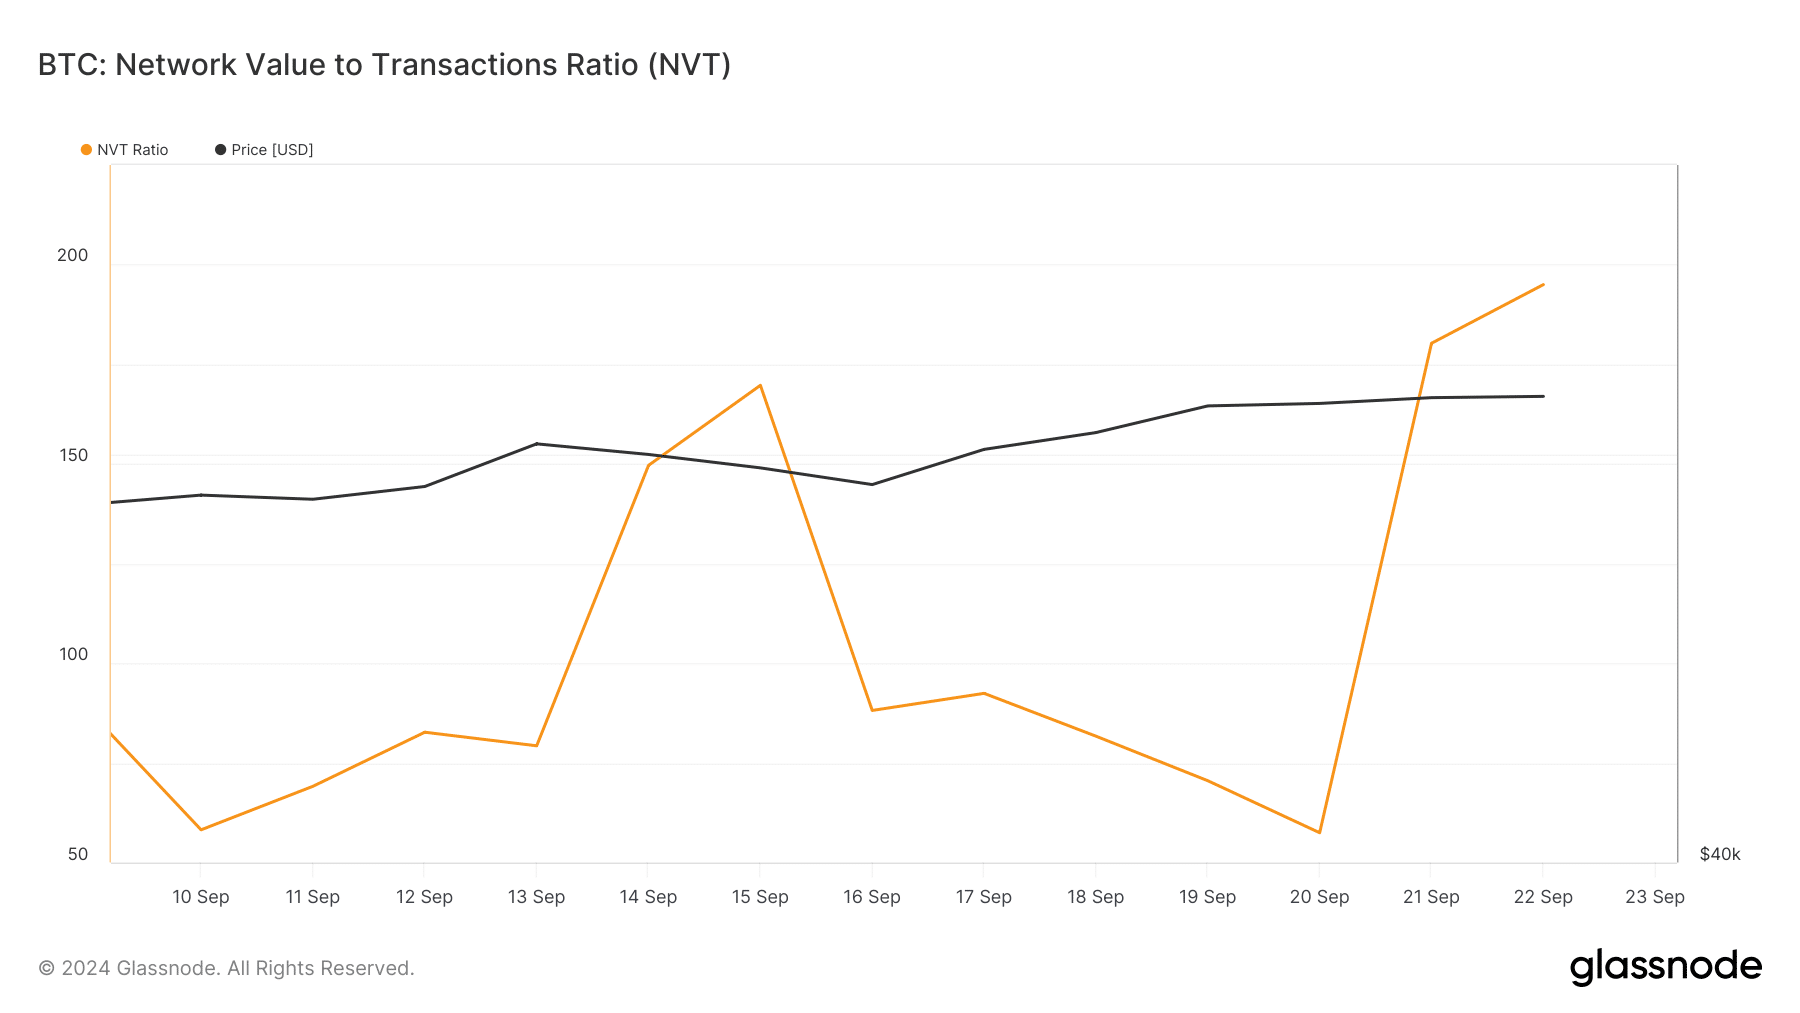
Despite the high buying pressure on the coin, some metrics suggested a potential price correction. For example, our analysis of Glassnode’s data showed a sharp increase in BTC’s NVT ratio.
A rise in the metric signifies that an asset is overvalued, hinting at a potential price correction.

Source: Glassnode
Additionally, AMBCrypto found that Bitcoin’s Relative Strength Index (RSI) was in an overbought zone. The stochastic indicator also fell into the same zone, further raising the likelihood of a price correction in the near future.

Source: CryptoQuant
However, at the time of writing, Bitcoin’s fear and greed index was in the “fear” zone. Typically, when the metric reaches this level, it indicates a potential price increase. Hence, AMBCrypto decided to analyze BTC’s daily chart to gain better insight into what to expect from the king coin.
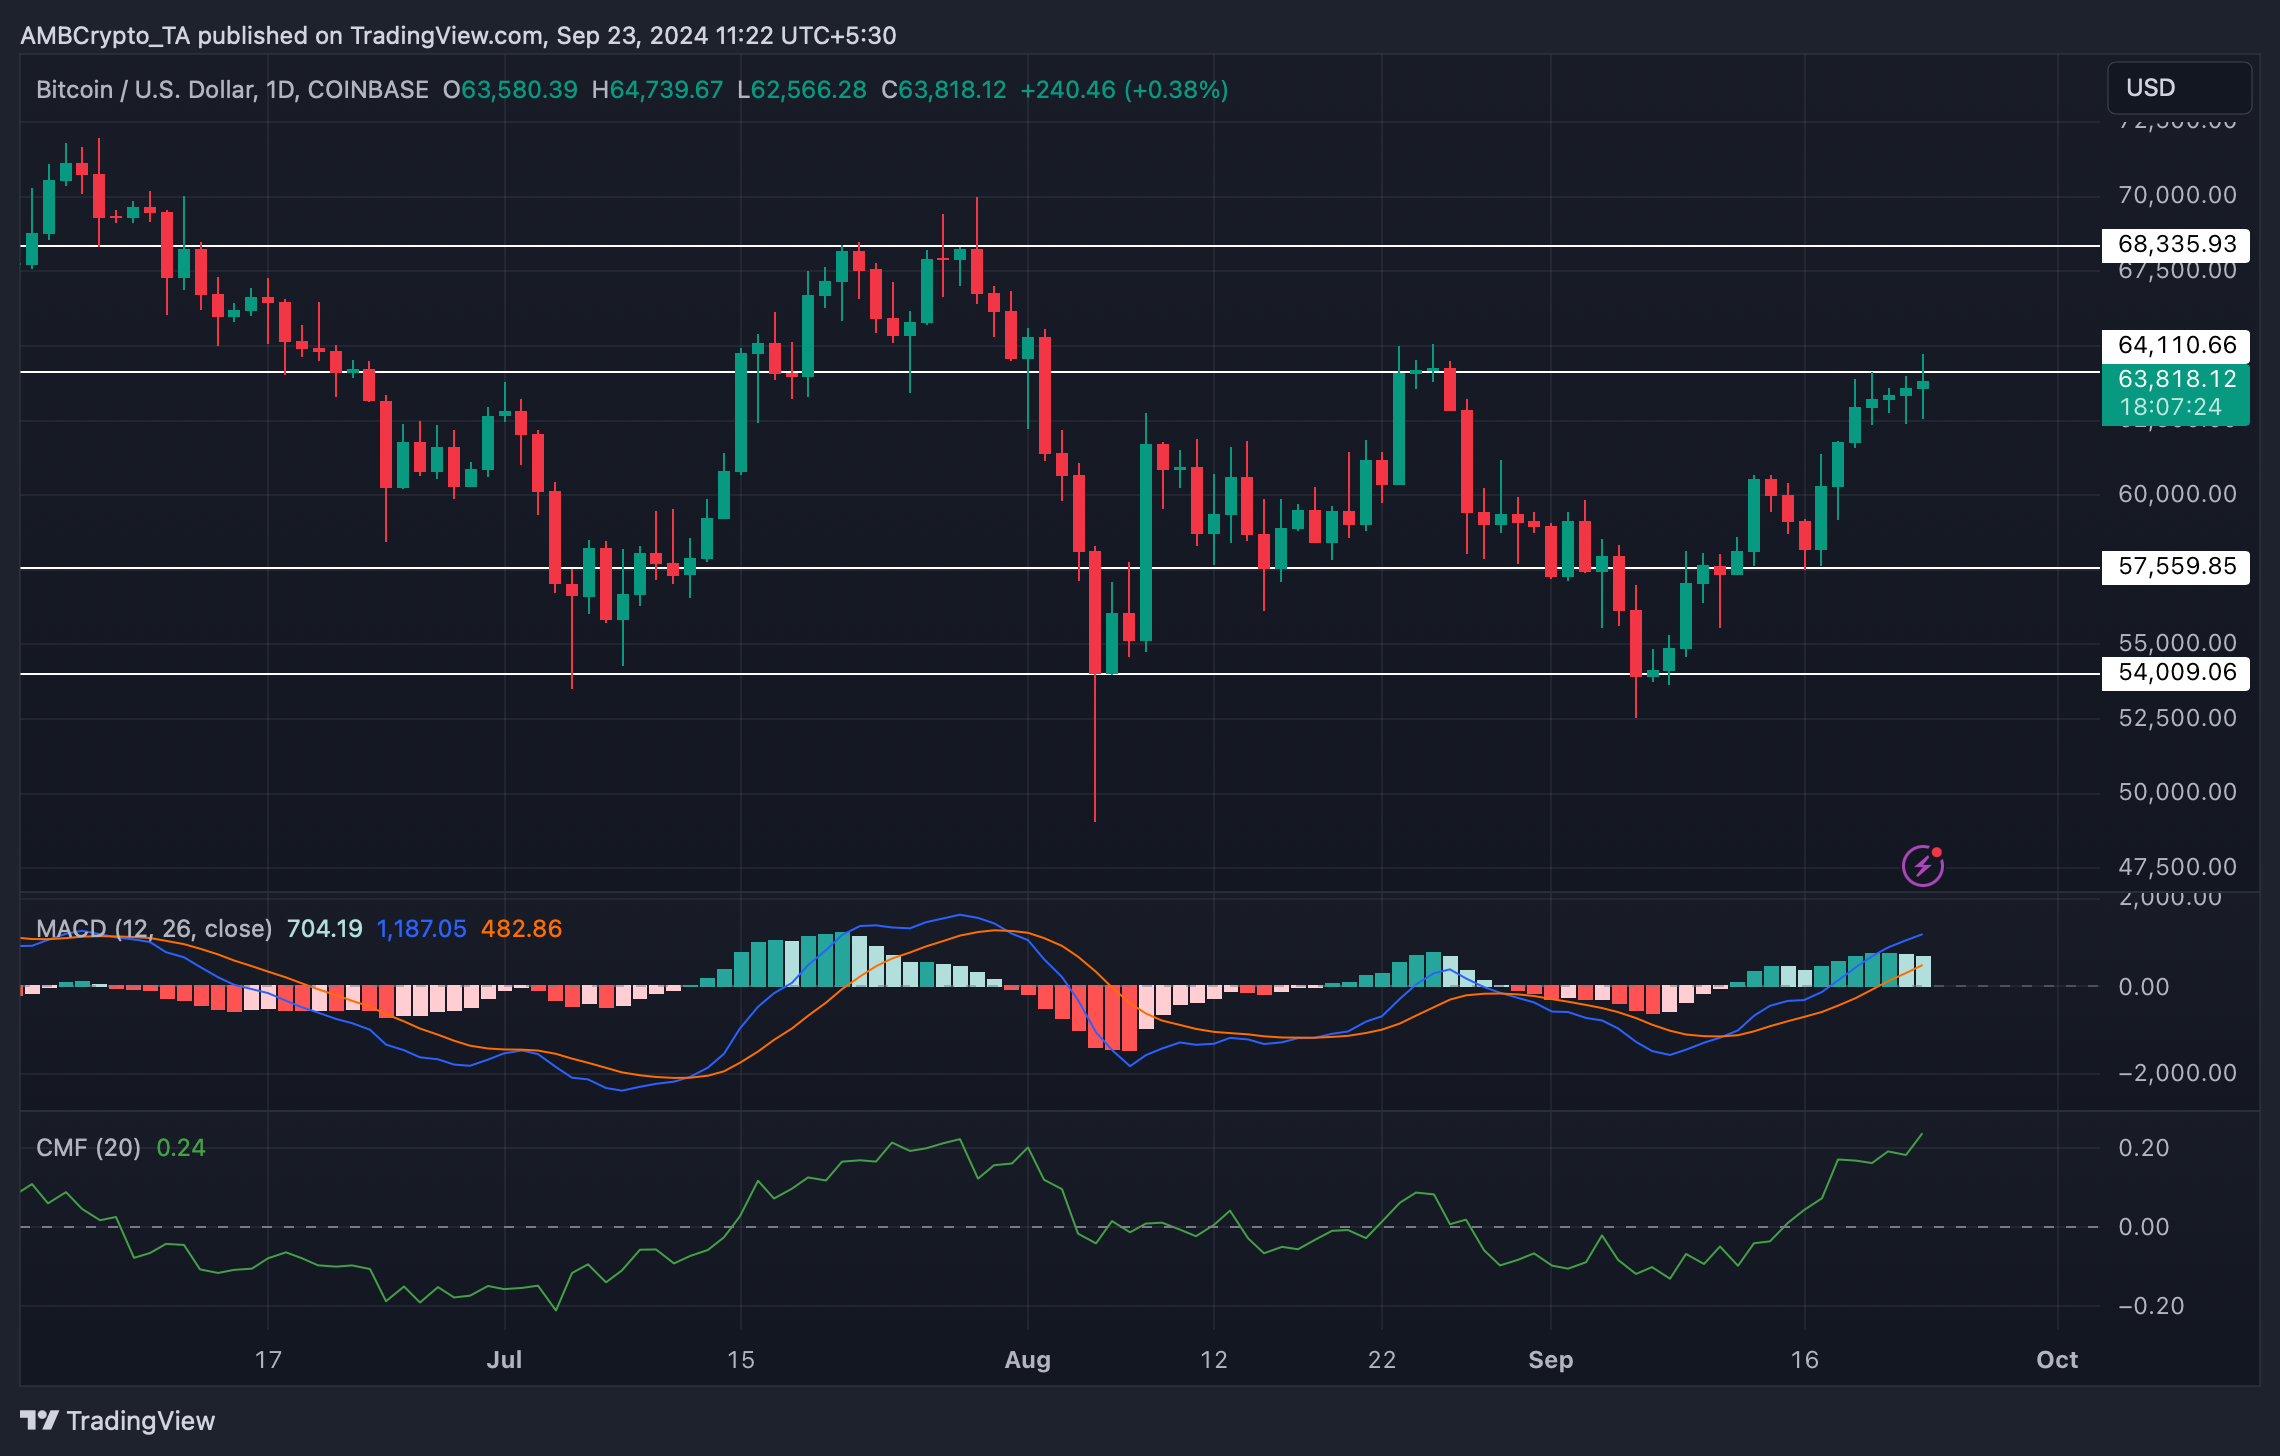
According to our analysis, BTC was once again approaching a crucial resistance at $64.1k. The encouraging news was that the MACD exhibited a bullish advantage in the market. BTC’s Chaikin Money Flow (CMF) also displayed bullish tendencies as it moved upwards.
Read Bitcoin (BTC) Price Prediction 2024-25
These indicators suggested that the chances of successfully breaking above the resistance were high. If achieved, BTC may soon target $68k.
However, in the case of a reversal to a bearish trend, investors might witness BTC dropping back to $57k.

Source: TradingView
Source link
#Bitcoin #buyers #step #push #BTC #64K


