Bitcoin’s 200-Day Moving Average Indicates Diminishing Bullish Trend: Implications for BTC Value

The 200-day simple moving average (SMA), a crucial indicator for Bitcoin’s long-term price trajectory, seems to be exhibiting a diminishing bullish drive amid lower job growth in the US economy reported in August 2024.
A Break Above The 200-Day SMA Is Needed For Bitcoin To Reclaim Bullishness
The 200-day SMA is acknowledged as a solid long-term metric for predicting future price directions of assets. The declining bullish vigor in Bitcoin’s 200-day SMA spells a lack of enthusiasm for short-term market players.
Related Reading
For the first time since October 2023, the 200-day SMA is on the brink of tipping towards a bearish phase. The day-over-day increment in Bitcoin’s average price has not exceeded $50 since the end of August, a marked decrease from the more robust $200+ shifts seen per day during the first semester of 2024.
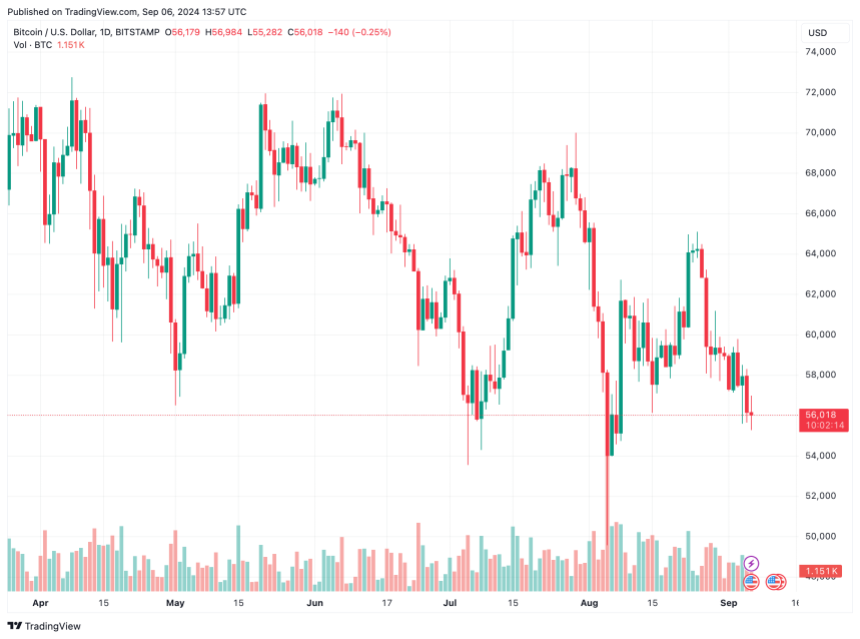
As of the latest update, Bitcoin’s 200-day SMA is at $63,840, which is approximately 13.96% above its current price of $56,840.
It is important to note that shorter-term moving averages, such as the 50-day and 100-day SMAs, have also experienced declines, with the 100-day SMA recently falling beneath the 200-day SMA in what is known as a bearish crossover.
As per cryptocurrency analyst Ali Martinez, the Stochastic RSI has indicated a shift from a bullish to bearish trend on Bitcoin’s bi-monthly chart. Such patterns in the past have generally led to substantial downturns, with potential corrections around 75.50%.
Moreover, Google Trends data reveals that public interest in Bitcoin has hit a low not seen since October 2023 when Bitcoin was trading near $30,000.
Further feeding the bearish outlook, Arthur Hayes, the former CEO of the BitMEX cryptocurrency exchange, commented that he has a short position in Bitcoin and foresees a potential drop to under $50,000 over the weekend.
Conversely, some analysts believe the $55,000 mark could be where Bitcoin reaches a bottom, with an infusion of liquidity in the US possibly renewing the absent buying interest in the cryptocurrency markets.
Bitcoin’s Underlying Foundations Remain Solid
Despite some analysts’ bearish perspectives on Bitcoin’s immediate price prospects, the fundamental bullish case for the cryptocurrency continues to stand firm.
Crypto analyst Crypto Jelle suggests a turnaround from Bitcoin’s lukewarm summer performance could come as soon as early October, potentially setting the stage for another uptrend.
Related Reading
Interest from institutional investors in Bitcoin is also swelling, exemplified by the announcement from Swiss banking titan ZKB on the introduction of Bitcoin (BTC) and Ethereum (ETH) trading and custody services. The current trading price of BTC is listed at $56,018.

Featured Image from Unsplash.com, Chart from TradingView.com
Source link
#Bitcoin #200Day #Average #Signals #Waning #Bullish #Momentum #Heres #Means #BTC #Price


