Downward Trend Persists: Is Bitcoin’s Bullish Momentum Slipping Away?

The Bitcoin price has continued to fall, dropping below the $100,000 level. BTC faces challenges and may slide further towards the $92,000 support area.
- Bitcoin has recently declined from the resistance zone at $102,000.
- The price is now below both $102,000 and the 100 hourly Simple Moving Average.
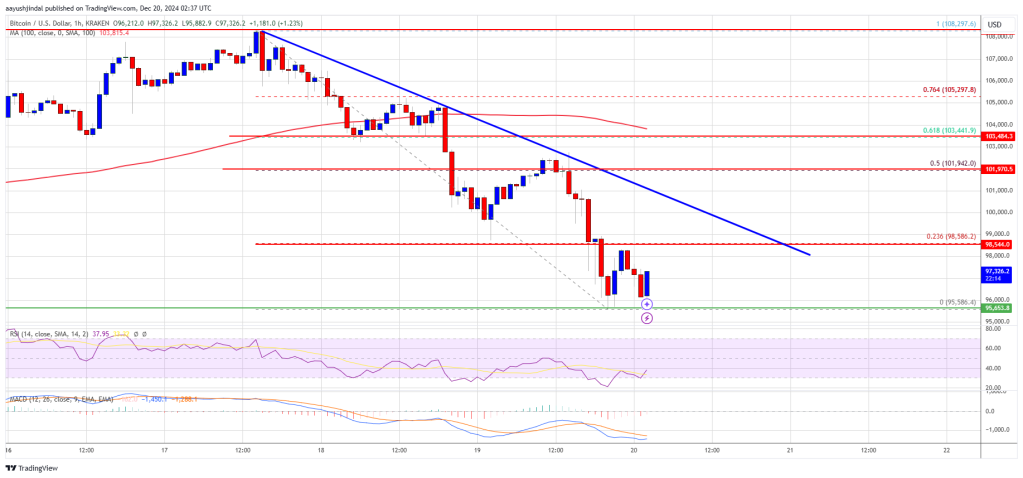
- A significant bearish trend line is established with resistance at $98,500 on the hourly chart of the BTC/USD pair (data sourced from Kraken).
- If the pair maintains above the $95,500 support zone, there might be a chance for a new rise.
Further Decline in Bitcoin Price
The Bitcoin price was unable to initiate another increase and has sustained its decline below the $102,000 level. BTC saw a surge in bearish dynamism after breaking below the $100,000 and $98,000 thresholds.
Price spikes were seen going beneath $96,500, reaching a low at $95,586 before commencing consolidation of losses. Notably, the same bearish trend line with resistance at $98,500 is seen on the BTC/USD pair’s hourly chart.
Bitcoin now trades underneath the $102,000 mark and the 100 hourly Simple Moving Average. The price might encounter resistance near $98,500, aligning with the 23.6% Fib retracement level of the recent drop from the high of $108,295 to the low of $95,586.
An essential resistance looms around the $100,000 mark. A decisive break above this resistance would potentially escalate the price further. The next critical resistance is pegged at $102,000, with a climb above that possibly driving further upward movement.

BTCUSD on TradingView.com
In such a scenario, the price might endeavor to reach the resistance level at $103,400 or the 61.8% Fib retracement level of the aforementioned descent. Further gains might push the price towards the $105,000 level.
Possibility of Further BTC Downturns?
Should Bitcoin fail to break the resistance zone at $98,500, it might keep descending. Immediate support lies close to the $96,200 level.
The next vital support is projected near the $95,500 level, with subsequent support around $93,200. Prolonged losses could potentially plummet the price towards the $92,000 support in the short term.
Technical Indicators:
The Hourly MACD – The MACD is currently accelerating in the bearish zone.
The Hourly RSI (Relative Strength Index) – The RSI for BTC/USD is presently beneath the 50 threshold.
Major Support Levels – $95,500, succeeded by $93,200.
Major Resistance Levels – $98,500 followed by $100,000.
Source link
#Bitcoin #Decline #Continues #Bulls #Losing #Control


